Editor’s Note: In this issue, Michael McWalter, former Director of the Petroleum Division and Adviser to the Government of Papua New Guinea, and erstwhile petroleum adviser to the Governments of Ghana, Liberia, Cambodia, Sao Tome, and South Sudan writes about Liquefied Natural Gas. He is a certified petroleum geologist, and technical specialist in upstream petroleum industry regulation, administration, and institutional development.
Natural Gas
Many people in Papua New Guinea will have heard of LNG, but how many of us know exactly what it is? LNG is Liquefied Natural Gas. That is natural gas that has come from within the Earth’s subterranean rock strata and then been chilled into a liquid, thus becoming Liquefied Natural Gas. It does not exist in the ground and there are no LNG wells, just gas wells from which to collect and aggregate large volumes of natural gas.
Natural gas, as we know it, is a useful fuel which can be burnt and may make heat for all manner of domestic, commercial and industrial purposes. It can also be used as a chemical feedstock to manufacture products like fertilisers and plastics. Natural gas is thus a valuable natural resource, but it is quite tricky to produce, handle and supply to customers, unlike crude oil and its classic liquid petroleum products such as petrol, kerosene, and diesel.
Turning natural gas into LNG can make natural gas even more accessible and useful. Unfortunately, many of the world’s gas fields are remote from the main consumers of natural gas. Natural gas is also bulky and thus quite expensive to transport. Methane, the primary constituent of natural gas, has a density of just 0.71616 kgs/cubic metre at normal temperature and pressure, which may be raised to 71.62 kgs/cubic metre at an applied pressure of 10,000 kilopascals (1,450 pounds per square inch (psi)), as may happen in a strong high-pressure pipeline. Therefore, natural gas is often supplied to customers through long pipelines.
If one liquefies natural gas to LNG, its density is raised to between 430 and 460 kgs/cubic metre (depending on its composition) making it much more compact and able to be shipped long distances on special insulated ocean-going tankers. We say that the energy density of natural gas at standard temperature and pressure as LNG is raised significantly, by more than 600 times for a given mass of gas. LNG ranges in density between 0.43 and 0.46 g/cm³ (depending on its exact ethane and propane content ratios), or slightly less than half the density of diesel. So, by liquefying natural gas, considerable energy is packed into a small volume as compared to natural gas in its gaseous state.
LPG is not LNG
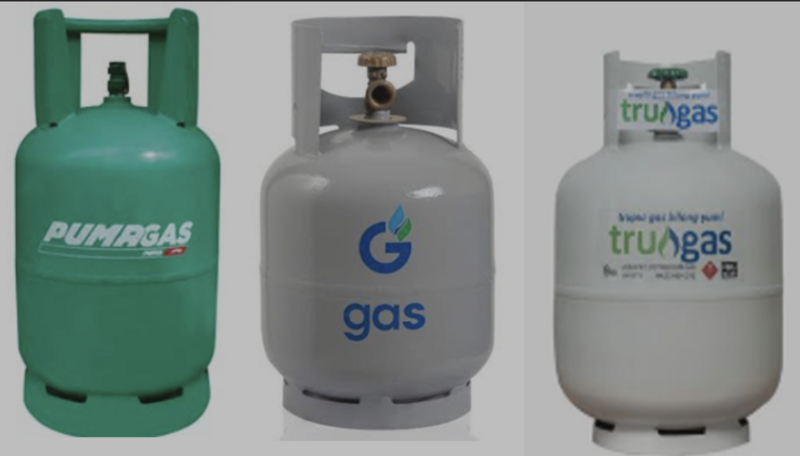
We have to avoid the common confusion with LPG, which is Liquefied Petroleum Gas (sometimes referred to as Liquid Petroleum Gas). We know LPG otherwise as bottled gas, sold under local brand names: Puma Gas, Geogas PNG (Ggas), and Trugas. LPG is primarily propane and/or butane which liquefy under moderate pressure at room temperature. The heavy steel bottles with which we are familiar keep the petroleum gases at pressures of 7 to 20 bar or 100 to 300 psi depending on the temperature and gas mixture.
Propane has a boiling point of between minus 42.25 to minus 42.04 degrees Celsius, whilst butane has a boiling point of minus 0.5 degrees Celsius. Because of this low boiling point, both propane and butane are kept as a liquid under high pressure in such tanks. As long as the outside temperature is above the boiling point temperature, the liquid will naturally boil off into the vapour required to run appliances. Because it can get quite cold in the Highlands of Papua New Guinea, and butane stops turning into gas (vapourising) between minus 0.4 degrees and minus 2 degrees Celsius, a propane-based LPG is preferred for higher altitude locations to ensure a free flow of vapourised LPG.
Liquefied Natural Gas
The content of LNG is normally mainly methane with minor amounts of ethane, propane and butane. The boiling point of methane is minus 161.5 degrees Celsius, a temperature far removed from our terrestrial experience. This is the world of cryogenics, the branch of physics and engineering that studies materials and phenomena at extremely low temperatures and, specifically for LNG, how gases liquefy. It is a different and very expensive high-tech world when compared to crude oil, pipeline gas, or LPGs. LNG has been described as the "Frozen Flame" – a rather poetic term. It gets this name because natural gas must be chilled to extreme cryogenic temperatures to turn it into a liquid, yet it can form volatile, freezing, and highly flammable vapour clouds, if exposed to the air.

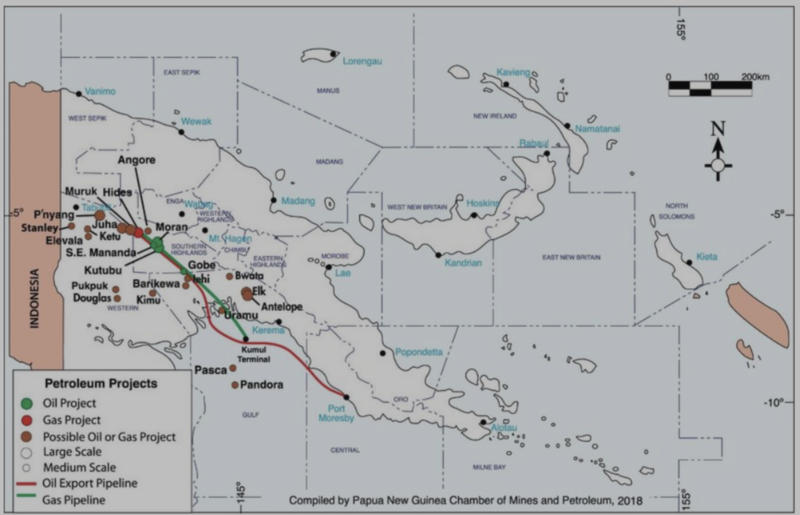
We have heard of the oil and gas companies exporting LNG, and of the LNG Projects like the PNG LNG Project, operated by ExxonMobil for the last 12 years, the planned Papua LNG Project currently being prepared by TotalEnergies, and the future P’nyang LNG Project being prepared by ExxonMobil.
These projects are spread out across the country. They produce, and will produce, natural gas from wells drilled deep into the ground that tap into various large accumulations of natural gas trapped in ancient porous and permeable sediments that have been discovered and appraised for their quality and extent. That natural gas may flow to the surface through the wells drilled into those accumulations, and after being cleaned up of basic impurities, it may be transported in gas pipelines hundreds of kilometres long to a liquefaction plant.
Cooling Natural Gas
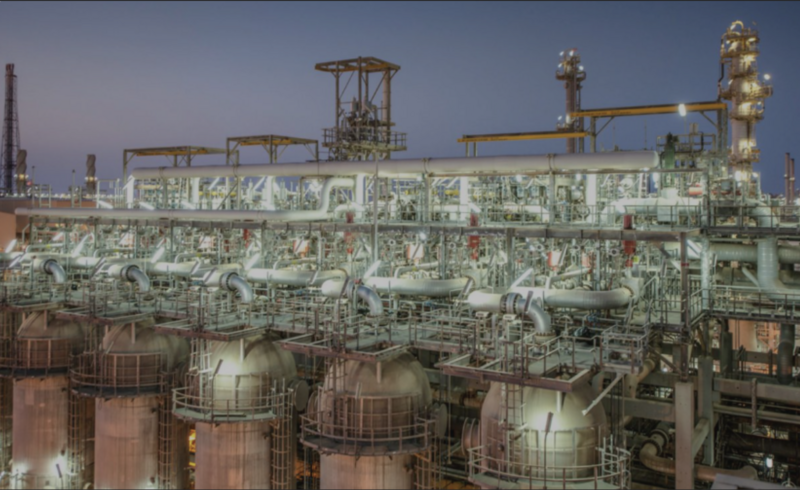
At a liquefaction plant the gas can be liquefied, or turned from its gaseous state into a liquid by intense chilling in what can only be called some of the largest refrigerators in the world. Just as we commonly know of water in its three states of matter: solid ice, liquid water and gaseous steam, so we can also chill natural gas until it too becomes a liquid. These refrigerators or liquefaction plants are enormous, and they cool the gas to approximately minus 163 degrees Celsius at which point the natural gas becomes a liquid at normal atmospheric pressure. Of course, just as with any refrigerator, this takes energy.
Turning a gas into a liquid, or condensing the gas, requires the extraction of the latent heat of vapourisation. The gas must release this exact same thermal energy to the environment in order to cool; that is 510 kilojoules per kilogram, for methane. Seeing as such processes are by no means 100% efficient, this means the power input for the liquefaction process is quite enormous. That energy is commonly provided by a portion of the gas feedstock, and is consumed on-site to operate massive refrigerant compressors and run the auxiliary equipment needed for the cooling process. The amount of natural gas typically consumed in this process ranges from approximately 7% to 15% of the total gas feedstock received at the plant. Allegedly, the PNG LNG plant is so well-engineered and operated by ExxonMobil that it only consumes about 7.8% of the feedstock gas stream for liquefaction. It said that the Papua LNG Project, to be operated by TotalEnergies, might use solar-powered electric drivers for its compressors, further reducing feedstock gas utilisation in processing, and thus nicely mitigating carbon dioxide emissions from the use of gas.
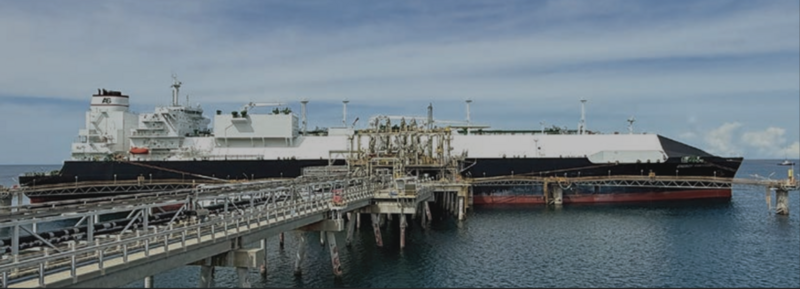
The beauty of this is that the natural gas, once so liquefied, occupies only about one six-hundredth of the volume it would in its gaseous state. Thus, the volume occupied by the natural gas in the form of LNG is vastly less, and the energy density of LNG is conversely massively heightened. By conversion of natural gas to its liquid form, it can be loaded onto ocean-going LNG tankers and can be delivered to any customer willing and able to pay for it, and receive it, anywhere in the world.
In many countries, natural gas is conveyed in large volumes by networks of pipelines taking it to diverse customers throughout the land. Also, in many parts of the world, natural gas that is excess to country needs and requirements may be exported by pipelines to countries nearby that need it, provided they can pay a handsome-enough price for the gas and its delivery. Examples of such are many. Some plans about twenty-five years ago for the development of Papua New Guinea’s discovered gas fields called for the pipeline transportation of Papua New Guinea’s natural gas to Australia, primarily to markets in Queensland. However, the proposed customers were not able to pay an adequate enough tariff for purchase of the natural gas and its long-distance transportation, as they then had ample supplies of locally-produced natural gas that were cheaper. If Papua New Guinea had pursued that project as a strategy for its natural gas development, it would have earned little from the development of those resources. Fortunately, common sense prevailed and the concept of developing the gas fields of Papua New Guinea for the supply of LNG to East Asian markets, where customers are prepared to pay a premium price for natural gas, sensibly prevailed.
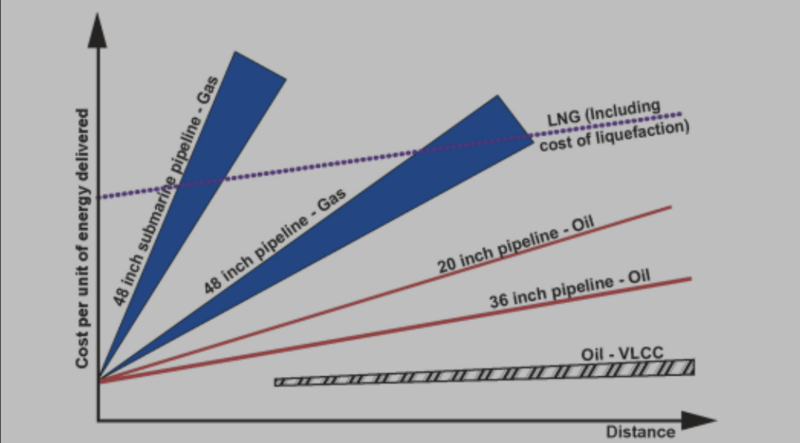
The cost of the conveyance of natural gas by pipeline naturally increases with the distance over which it is to be conveyed, such that for extremely long distances the transportation of natural gas as LNG on ocean-going tankers becomes cost effective. Necessarily, pipelines are still the preferred mode of conveyance of natural gas on land, but for maritime routes of supply, LNG is the best mode of conveyance, unless a maritime pipeline is short and cost effective, and cannot be avoided.
LNG – a Global Business
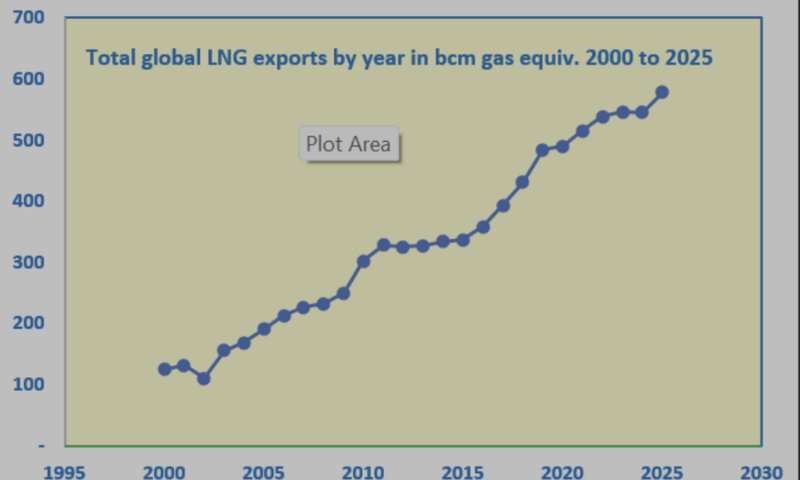
In 2025, some 578.5 billion cubic metres of natural gas, equivalent to 387 million tonnes per annum (mta) was produced and moved around the world as LNG from around 20 exporting Nations to around 30 importing Nations. International trade in LNG grew by 6.5% in 2025, after two years of little or no growth. This was led by a large increase in LNG exports from the USA, with it producing 147 mta, or 25.4% of global LNG. This was followed by Qatar and Australia at 19.2 mta and 18.2 mta respectively. Papua New Guinea produced a modest 7.9 mta, about 2.0% of global LNG supply.
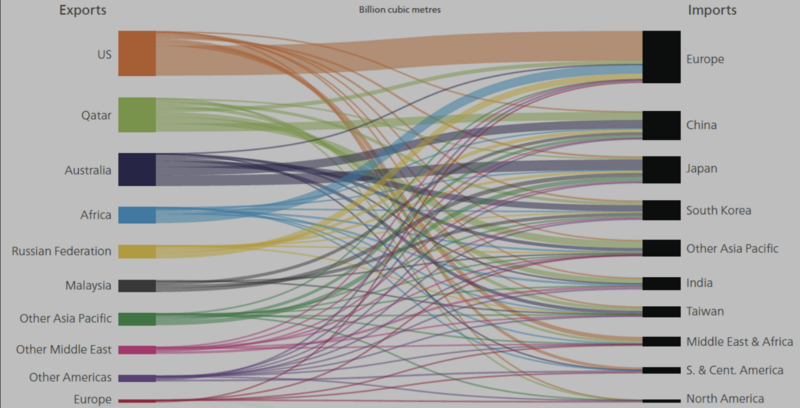
The LNG business uses only about 15% of all the natural gas produced. The vast majority of natural gas, about 70%, is consumed domestically within the countries in which it is produced, while the remainder is used for international cross-border trade transported via pipelines in a compressed gaseous state. LNG has the advantage that it can be transported anywhere to any port that can receive its liquefied cargo. LNG is not dependent on point-to-point pipelines, which are generally dedicated to the supply of natural gas from one nation to another, forever. LNG projects do nevertheless still have to arrange for customers willing to pay the premium price for natural gas delivery as LNG.
The LNG Chain
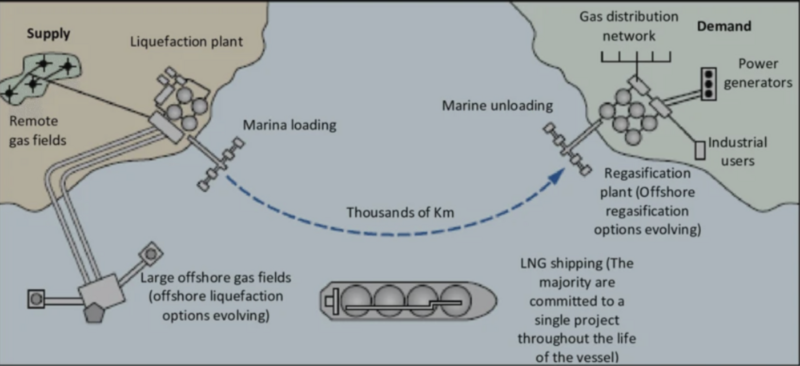
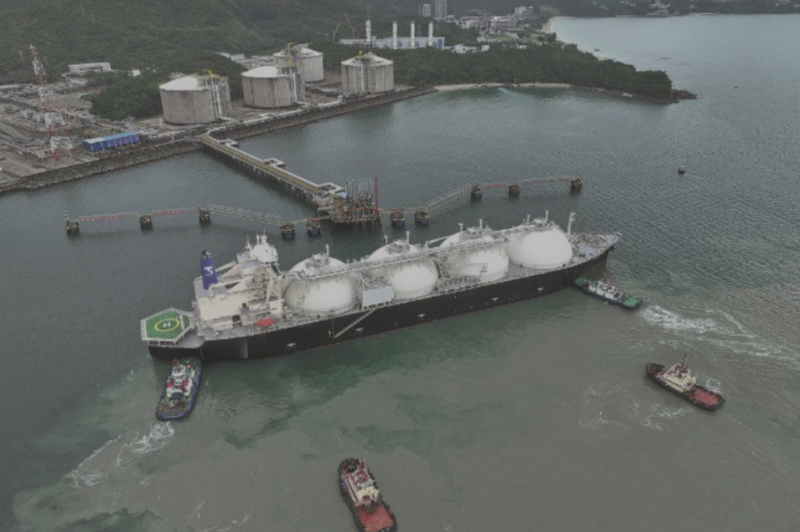
LNG projects tend to have dedicated customers with corresponding LNG sales and purchase agreements. These are binding contracts, for considerable periods of time to guarantee the financing of gas field development, and construction of gas gathering and transmission pipelines, gas liquefaction plants, and storage and loading facilities. The costs can be massive. Furthermore, LNG tankers are needed; these are generally owned by specialised maritime shipping companies and major energy corporations, and are normally chartered. Importantly, the customers buying the LNG also have to have facilities to receive the LNG, store it, and re-gasify it back into the gaseous form for transmission and distribution to end-users. These facilities are LNG receiving terminals, which are built at the expense of the LNG buyers, or other parties that may lease them to the buyers. Altogether, for an LNG project to be successful, all aspects have to be developed simultaneously: the gas field, gas pipelines, liquefaction plant and LNG storage, loading terminals, LNG tankers, marine receiving terminals, regasification terminals, gas off-takers and customers. This is what we call the LNG Chain.
Aside from the contractual sales and purchase arrangements, LNG export is not necessarily limited in its destination, especially as we saw in times of global upsets, such as the Covid pandemic. Some cargoes are sold on the spot market outside the framework of long-term contracts; these sales are typically for single shipments for delivery within three months of the transaction date. Prices in the spot market can be fixed, or indexed directly to oil or gas prices. Such cargoes can go wheresoever the cargo obtains the best price.
Thirty years ago, when the concept of LNG development was first examined by the Government of Papua New Guinea, there were just eight Nations exporting LNG and eight Nations importing LNG. The LNG industry has grown significantly into a truly global industry providing a flexible form of energy, often as an alternative to fixed pipeline gas supply arrangements, or exhausted domestic natural gas supplies. LNG usage has grown by 363% since the year 2000. According to many reports, that growth will continue with Shell, a major player in the LNG markets, saying that it expects it to grow to 65% from today’s level of 578 billion cubic metres (BCM) gas per year up to 955 BCM gas per year (equivalent to 700 mta LNG) by 2050 as countries continue to prioritise flexible and reliable energy security offered by gas and LNG. This would be just a 2.4% growth per annum in LNG production and demand. Papua New Guinea will likely contribute to that growth with the development and inception of LNG production by the planned Papua LNG and P’nyang LNG Projects.
Gas Quality and Specifications
When natural gas emerges from its subterranean reservoir, either dissolved in liquid oil or with natural gas liquids dissolved in a gaseous vapour, it is typically in a mixture of petroleum fluids. Whenever oil and gas are produced, it is a fundamental requirement to separate the liquids from the gaseous components, and the various petroleum fluids from any contained water and sediment. Most often this is performed near the location of the producing natural gas field and these are the first processing steps, which are known as gas conditioning.
With separation, filtering and dehydration done, the gas may yet contain toxic and corrosive gases like hydrogen sulphide (H₂S) and carbon dioxide (CO₂). These components have to be removed to prevent damage to pipes and vessels, and to avoid their freezing and solidification in the cryogenic sections (typically at temperatures around minus 160°C) in a process known as acid-gas removal, or gas sweetening. Further dehydration of the natural gas has to be undertaken to almost completely remove (to less than 1 part per million) any vestigial water which might freeze and cause blockages in the liquefaction plant. Another troublesome impurity in natural gas is mercury which may cause severe corrosion and cracking in the aluminium cold boxes and heat exchangers used in liquefaction facilities.
LNG feedstock with high nitrogen content causes operational issues by lowering the liquefaction temperature and generating excess boil-off gas. To utilise or fix it, operators use cryogenic distillation to separate the gas, blend it with leaner feedstocks, or route the vapourised nitrogen for use for facility safety and maintenance.
Sometimes there may be some helium content in the natural gas. Helium is a valuable commodity used in semiconductor manufacturing, aerospace, and MRI machines. Even if the natural gas feedstock has a low helium concentration (less than 0.1% to 0.3%), the massive scale of an LNG plant concentrates the helium significantly, making extraction highly profitable. As natural gas is liquefied, helium remains a gas. It builds up in various parts of the LNG plant. Plant operators then use specialised cryogenic extraction, membrane separation, and adsorption techniques to draw out crude helium (50-70% purity), and then refine it to grades >99.999% pure.
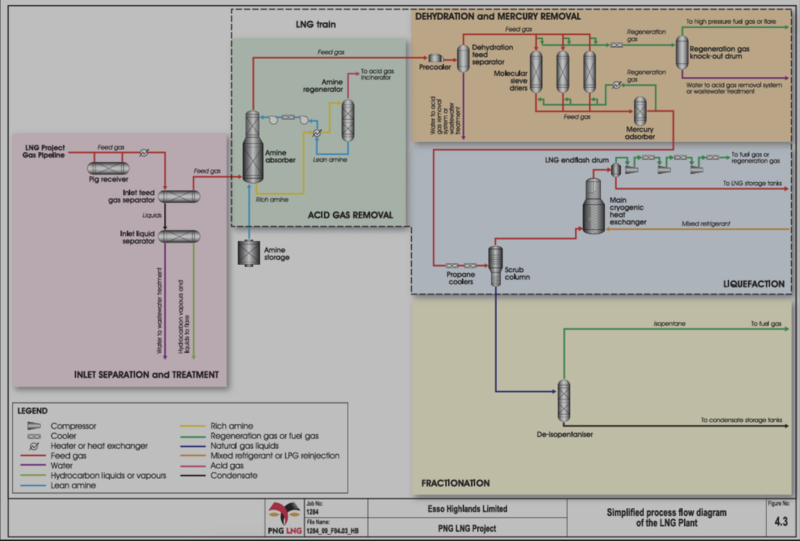
Heavier hydrocarbons, or natural gas liquids, typically pentane, hexane, and benzene have to be removed to avoid premature freezing and the fouling of the liquefaction processes. The inclusion of some ethane, propane and butane in the liquefaction feedstock gas changes the quality of the LNG and its heating value, or energy content. The inclusion of these components is a matter of LNG product design and specification to meet customer requirements.
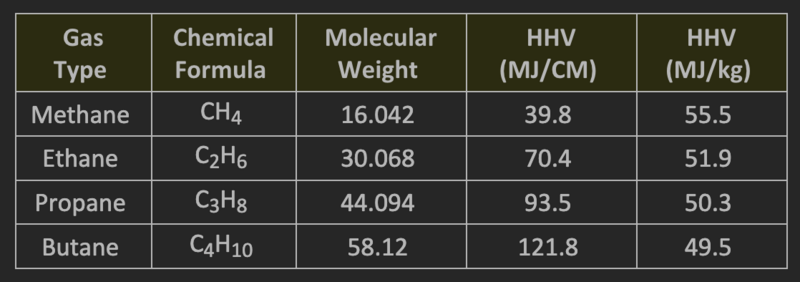
Japan's domestic gas pipeline network is strictly designed to handle "rich" gas (gas with more ethane, propane and butane). LNG imported into Japan typically has a higher heating value (HHV) of 39.7 to 43.3 megajoules per cubic metre (MJ/CM). Utilities consistently adjust the energy content to 45 MJ/CM (about 1,140 BTU/scf) before distributing it to homes and businesses. Because LNG imported from the U.S. and Canada is typically "lean" (dry, and thus lower in heating value), Japanese buyers blend it with rich LNG or enrich it with LPG to meet their domestic heating standards. LNG imported into Europe has a typical higher heating value (HHV) of roughly 50 MJ/CM (or about 1,267 BTU/scf). However, the exact heating value of LNG shipments into Europe fluctuates depending on the source region and liquefaction process, ranging roughly from ±10% to 15%.
LNG is paid for by customers on the basis of its heating value, so no value is lost if some ethane, propane and butane remain in the natural gas feedstock for liquefaction. Every component earns value according to its mass and contribution to the heating value.
It has previously been argued that the PNG LNG Project should have stripped its ethane, propane and butane to serve as petrochemical feedstock. Whilst noble in notion, such stripping would have cost a lot of money, perhaps as much as US$ 400 million for the LPG stripping plant alone, and one wonders where the industries are that such stripped LPG could have supported. Studies found that below a crude oil price of US$ 60 per barrel, LPG stripping was not economically viable.
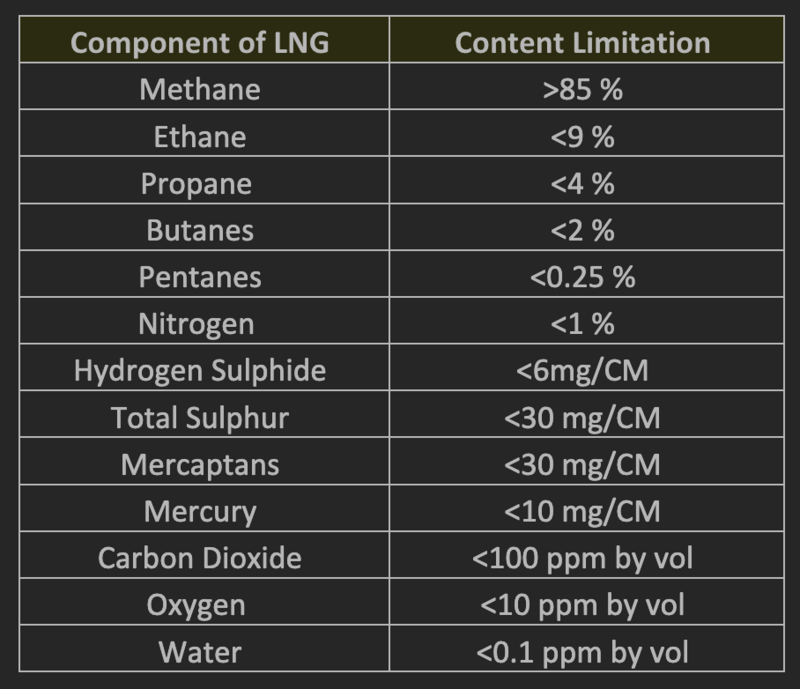
The specification of LNG produced by the PNG LNG Project seeks to meet the Japanese specifications as two of the major long-term customers for the PNG LNG Project are Osaka Gas Company Ltd and Tokyo Electric Power Company. The delivered LNG thus has a higher heating value of between 41.0-42.5 MJ/CM (1100 to 1140 Btu/scf). LNG production aims to have at least 85% methane content, and strictly limits other components to try to remain within an acceptable range of gas specifications.
Gas Quantities and Measurement
Whilst the oil and gas exploration industry likes to measure gas flows in standard cubic feet per day (SCFD) (or standard cubic metres per day in the metric system [SCMD]), volume is not an appropriate measurement for what is sought by buyers: energy content. As seen in Figure 11, the energy content (typically, the higher heating value) per cubic metre of natural gas rises in proportion to the carbon number of the particular type of gas, whilst the energy content per mass stays more or less similar, though there is a small systematic decline. Thus, measurement of the mass of the gas supplied as LNG is normally the critical quantity in gas sales agreements. Then, knowing the energy content per unit mass of the LNG, it is relatively easy to determine the amount of energy provided. We commonly hear reports of the PNG LNG project shipping millions of tonnes (mta) of LNG to its customers. The heating value will still vary from time to time within agreed limits, depending on gas field operations for the production of natural gas and depending on which fields are contributing to the flow of natural gas feedstock to the LNG plant.
The measure of energy content of natural gas or LNG is typically provided in terms of energy units per unit of mass, such as kilojoules per kilogram (or in imperial units as BTU per pound). It is sufficient for gas explorers to use volumetric measurements, such as million standard cubic feet per day (MMSCFD where M denotes 1000, or mille), or million standard cubic metres per day (MSCMD, where M stands for million). However, for LNG sales, the heating value of the gas is what the customers pay for. Yes, the units can be confusing, and one constantly has to check one’s units and abbreviations, especially the use of ‘M’. In the gas industry, one needs to be most conversant with all manner of units of measurement and their abbreviations, and be on constant guard against incorrect interpretation. It is always good to give the numbers a sense check.
So, in the case of the PNG LNG Project, it is reported that it produced 7.9 mta LNG in 2025 which had a higher heating value of less than or equal to 1,140 BTU per cubic foot, or 42.5721 MJ/CM. Such a gas would have a specific gravity with respect to air of 0.633798. If the density of air is 1.2250 kg/CM (as used in ISO conditions at 15 °C and 101.325 kPa), the density of the natural gas that has been liquefied is 0.7764 kg/CM. So, for 7.9 mta of LNG production, at 7.8% gas usage during liquefaction and 95% plant uptime, gives us an estimated natural gas feedstock rate of about 1,124 MMSCFD, or 1.124 billion SCF (BCFD). This is not a rigorous calculation, but only one to show the scale of the current PNG LNG Project development and how much natural gas it produces.
By direct comparison, the Hides Gas to Electricity Project uses just 15 MMSCD to power the Porgera Mine electric power station, which produces 75 MW of electricity. It is simple arithmetic to show that the volume of gas used by the PNG LNG Project is an approximate equivalent to 5,620 MW or 5.62 gigawatts (GW). This has to be compared to Papua New Guinea’s estimated total installed electricity generation capacity of just around 600 MW.
LNG Sales
Sales of LNG are typically made to distant customers beyond the reach of gas pipeline supply, and obviously to those countries that are energy deficient, either by having little or no endowment of oil and gas resources, or not having enough to satisfy their present-day needs. Quite often countries take to importing LNG when their own gas resources have been depleted after the clamour to monetise them when first discovered by export and the earning of valuable foreign exchange.
Most often LNG Sales and Purchase Agreements are negotiated and agreed prior to the development of a particular LNG export project for a substantial period of time, at least ten years, and often spanning as long as 15 up to 25 years. These agreements effectively provide financial guarantees for the financing of the development of that project. Though there are some spot trades of LNG cargoes on the open market, most LNG supply is governed by term agreements for the supply of a specified amount of LNG per year for a given period. Spot sales are for individual cargoes for immediate delivery without a long-term supply contract.
The PNG LNG Project, which cost US$ 19 billion to develop, initially secured long-term binding agreements with four major Asian energy buyers: Tokyo Electric Power Company (TEPCO); Osaka Gas Company; China Petroleum and Chemical Corporation (Sinopec) and CPC Corporation of Taiwan. The PNG LNG Project routinely produces up to 8 mta LNG, significantly above its nameplate capacity of 6.6 mta. Amounts of LNG above and beyond the original contracted amounts have been the subject of some mid-term sales to the likes of PetroChina and BP Singapore, and some spot sales to CPC in Taiwan. Typically, LNG Sale and Purchase Agreements are strictly held in commercial confidence and rarely ever see the light of day, but once done, the sellers and buyers usually announce their arrangement with enthusiasm.
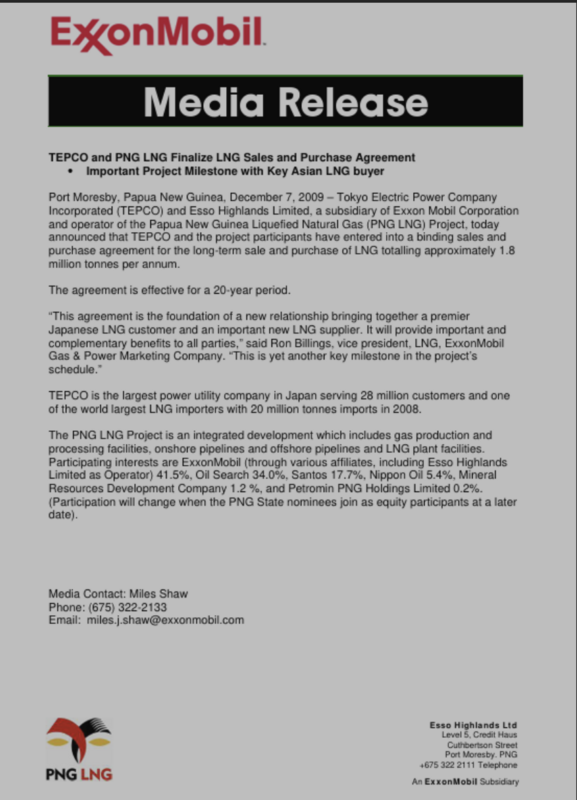
Taiwan recently oddly halted approximately US$ 800 million in scheduled spot LNG purchases from the PNG LNG Project after Papua New Guinea ordered the closure of Taiwan’s Taipei Economic Office in Port Moresby. However, long term contracted LNG volumes are legally insulated and are much harder to unwind, so Taiwan’s response has specifically targeted uncommitted spot market cargoes only. In a reassuring statement PetroChina expressed interest in buying surplus LNG from the PNG LNG Project.
The necessity for foundation buyers of LNG is very important for LNG projects, and recently there has been considerable speculation about the initial buyers for the LNG that will be produced from the forthcoming Papua LNG Project. No news has been announced about potential buyers, leading some observers to speculate that the Project might be having difficulties with identifying suitable buyers. However, it is more likely that the Papua LNG Project joint venture led by TotalEnergies is just being tight-lipped about its LNG marketing.
With the events of the past few months in the Middle East, Pacific-based LNG sources ought to be prized, especially as they are not compromised by any strategic maritime straits. PNG has open-ocean access to East Asian LNG customers. The closure of the Strait of Hormuz removed a substantial amount of global LNG supply from the market. This has demonstrated that the risk of physical disruption of LNG supply is now real, and that in turn damages the guarantees of supply that exist in LNG sales and purchase agreements. There is now a premium emerging for LNG supply from reliable producers through reliable routes of supply. The supply of LNG into the energy deficient markets of East Asian economies seeks more assurance of physical security of supply. This has caused customers to turn to US LNG exports as well as Australasian suppliers such as Papua New Guinea. This bodes well for the Papua LNG Project, its capture of foundational customers, and the continued sale of cargoes from the PNG LNG Project.
As the Papua LNG Project is still finalising its commercial framework and working towards a final investment decision (FID), the Project will most likely be targeting major international buyers in key Asian markets, such as Japan, China, and South Korea due to the region's geographic proximity and carefully assessing the ability of those countries to afford to buy energy in the form of LNG at a premium price.
Less buoyant economies within the region, although would-be buyers and wishing to import LNG as an energy-providing expedient, may have more difficulty demonstrating their financial capability to pay for cargoes and may have difficulty demonstrating that they have ready access to foreign exchange with which to pay for purchases. Again, the banks that are providing project financing would want to see not only binding Sales and Purchase Agreements, but such binding agreements would have to be with customers with good credit ratings and with guaranteed access to foreign exchange.
LNG sales are made on the basis of energy content sold to the buyer, typically measured in Million British Thermal Units (MMBTU) globally, especially in international spot and long-term contracts tied to US and Asian markets. However, the metric energy unit GigaJoules (GJ) is also widely used, particularly in domestic Australian and some regional European frameworks.
Oil referenced pricing has been a feature of LNG markets for a long time. The price paid for LNG is determined by reference to a formula linked to the crude oil price, typically the Japanese Customs Cleared Crude (JCC) index or Brent crude. The former is the weighted-average price of crude oil imports into Japan based on official customs clearance statistics, and is widely used as a benchmark price in East Asian energy markets. Platts JKM is the LNG benchmark price assessment for spot sales of physical cargoes. It is referenced in spot deals, tenders and short-, medium- and long-term contracts both in Northeast Asia and globally. It reflects the spot market value of cargoes delivered ex-ship (DES) into Japan, South Korea, China and Taiwan. Deliveries into these locations equate to the majority of global LNG demand. In Europe the Dutch TTF natural gas benchmark trades in Euros per megawatt-hour (MWh). The TTF index refers to the Title Transfer Facility, a virtual trading hub in the Netherlands that serves as the primary price benchmark for natural gas in Europe. Prices fluctuate daily based on regional demand, geopolitical updates, and liquefied natural gas (LNG) cargo shipments. In the USA, the Henry Hub is a physical natural gas pipeline distribution point in Erath, Louisiana. It serves as the official delivery location and pricing benchmark for the New York Mercantile Exchange (NYMEX) natural gas futures contracts, setting the standard price for the North American natural gas market.
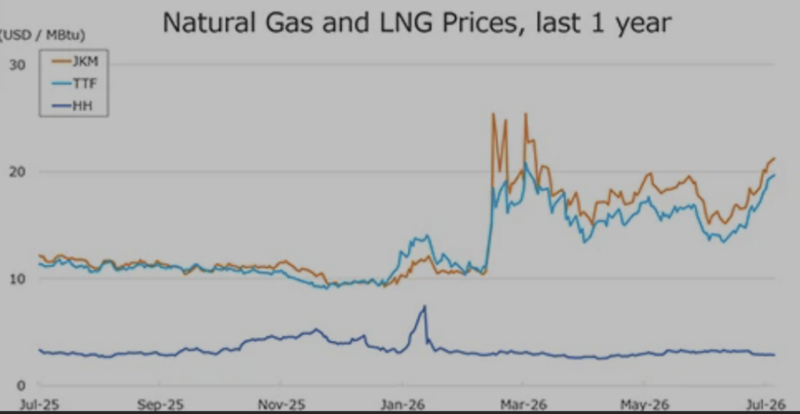
The historical reason for LNG pricing being linked to crude oil is that early LNG trades were primarily designed around substitution of oil for power generation and industrial supply of energy. Substitution values were essentially based on energy values equivalence. More than 50% of LNG cargoes are still priced using crude referencing, particularly in the Asia Pacific market. The crude oil price referencing provides a durable, stable and predictable pricing mechanism that is transparent and genuinely market responsive. To provide added stability, LNG sales and purchase agreements include cap-and-floor mechanisms that limit the indexing by reducing the reference to crude oil during abrupt spikes and troughs in crude oil price. This gives comfort to both the producers and the buyers, and enables them to continue production supply and cargo receipt during periods of crude oil volatility.
Admittedly, crude oil and natural gas as LNG have different markets. Whilst crude oil has an integrated and global price reference system, LNG pricing can be affected by regional and seasonal factors, especially LNG spot sales prices. During the massive economic disruption caused by the Covid-19 pandemic, LNG oversupply caused prices in Asia to fall to as low as US$ 3 per MMBTU, or about US$ 15 per barrel of oil equivalent (boe). Meantime, the European energy crisis of 2021-2022 caused Asian spot LNG prices to spike at US$ 60 per MMBTU, or about US$ 300 per boe. More recent crises in the Middle East have again heightened crude oil prices, and hence LNG prices that are crude oil referenced, plus security of supply concerns have added a further premium.
Global LNG storage hubs are evolving to buffer the supply of LNG. Within Asia, there are LNG storage hubs in the key importing nations such as China, Japan and Korea. Singapore is trying to replicate its success as a crude oil hub by providing LNG commercial and bunkering hub facilities. Thailand, Vietnam and the Philippines are also variously creating regional and domestic supply hubs. Some large integrated oil and gas companies are also intent on being global LNG suppliers gathering LNG from various LNG projects in which they are involved and selling equity LNG to customers.
The Usefulness of LNG
LNG is a cleaner burning fuel than coal or oil, in terms of its combustion and consequent air pollution and carbon dioxide output. Its total climate impact has been the subject of considerable debate due to LNG’s energy-intensive processing and leaks of natural gas from the system of gas supply. However, the combustion of natural gas releases about 40% less carbon dioxide than burning coal, and fewer noxious substances are released. The combustion of LNG produces almost no sulphur dioxide or heavy particulates, or soot.
However, there are some hidden emissions. Natural gas can escape (so-called fugitive emissions) during its extraction, pipeline transportation, and liquefaction, and methane, its main component, is about 80 times more potent in trapping heat in the atmosphere than carbon dioxide.
The process of cooling natural gas to liquefy it at -162°C and shipping it overseas on large tankers requires a considerable amount of energy, which adds to the overall greenhouse gas footprint. The PNG LNG Project is said to use about 7.8% of the feedstock gas stream for liquefaction. But that still represents the combustion of 88 MMSCFD, or about six times more than the Hides Gas to Electricity Project produces and consumes for electric power generation.
The so-called fugitive emissions of natural gas are not normally entertained by respectable oil and gas companies which always try to keep petroleum of any kind, be it liquid or gas enclosed behind steel at all times. Much depends on the quality of the operating company and regulatory standards. Moreover, it is not uncommon for some oil-rich nations to still persist in burning off or venting associated gas when producing crude; such is simply arrogantly profligate.
Overall, the Intergovernmental Panel on Climate Change (IPCC), the United Nations body for assessing the science related to climate change, says that natural-gas power produces 50% fewer emissions than coal power — even when fugitive natural gas emissions are taken into account. The IPCC says, “Taking into account revised estimates for fugitive methane emissions, recent lifecycle assessments indicate that specific GHG emissions are reduced by one half (on a per-kWh basis) when shifting from the current world-average coal-fired power plant to a modern natural gas combined-cycle (NGCC) power plant.”
Coal currently accounts for about 45% of global carbon dioxide emissions from fuel combustion, and the world burns over one million tons of coal every hour. So, clearly a replacement of coal by LNG is a step in the right direction, but inevitably the burning of any hydrocarbons will result in carbon dioxide as a product of combustion. Both within the Middle East and the USA, this process continues unabated where natural gas is often flared and wasted as operators seek to produce and sell just the petroleum liquids.
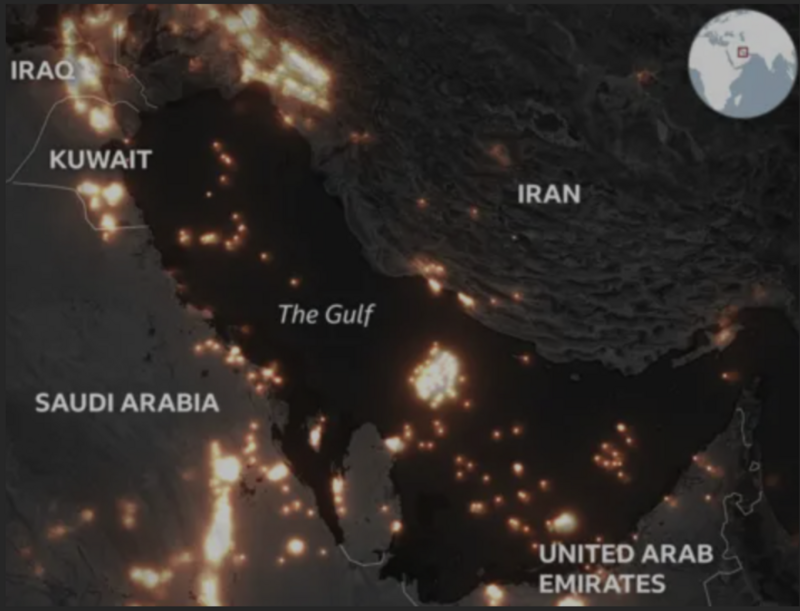
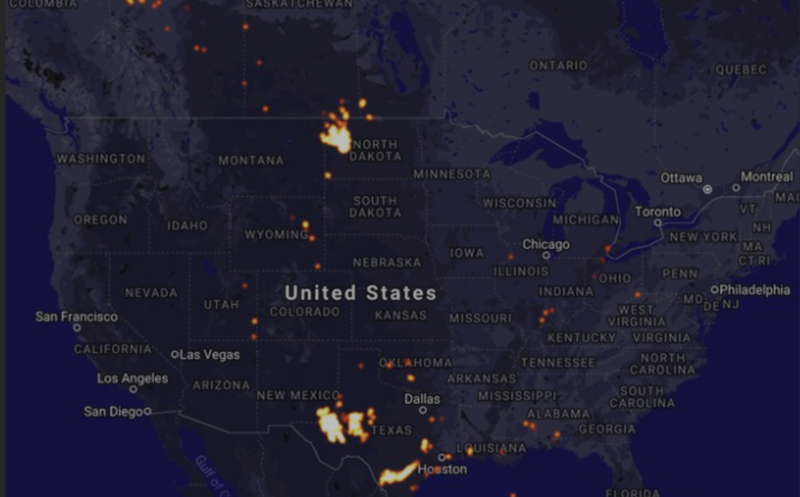
Throughout the energy industry there is a constant quest for lower emissions. Specifically, new LNG plants vie to become cleaner, either by reducing the amount of gas consumed in powering liquefaction processes or replacing the energy for such with alternative non-hydrocarbon supplies, such as solar or hydroelectric and/or wind power. The International Energy Agency has said that new technology can cut LNG emissions by up to 60%.
In general, operators of LNG plants are also endeavouring to improve operations for heightened safety, resilience, and efficiency. The application of the latest automation, digitalisation, and cybersecurity strategies are helping facilities optimise performance across the LNG value chain. Such may also provide better uptime, cost efficiency, compliance, and asset performance.
Papua New Guinea’s LNG Projects
In the absence of a developed economy that might provide domestic, commercial and industrial markets for Papua New Guinea’s gas resources, successive Governments have elected to permit export-focused gas development projects to be pursued. This has been allowed on the basis of Papua New Guinea garnering a significant share of the net take of such projects, and gaining a boost to its overall economy. Whilst the pursuit of revenue-raising gas development projects may provide valuable financial inputs into the economy of the Nation today, they will ultimately exhaust the gas resources upon which they are based. Most likely further gas resources will indeed be identified, but that requires exploration, which needs to be incentivised somehow. In recent years, incremental progress has been made towards some domestic gas utilisation, but with such a dispersed and disparate demand for energy, LNG development still remains the main focus, one might say, somewhat akin to cash cropping rather than subsistence farming.
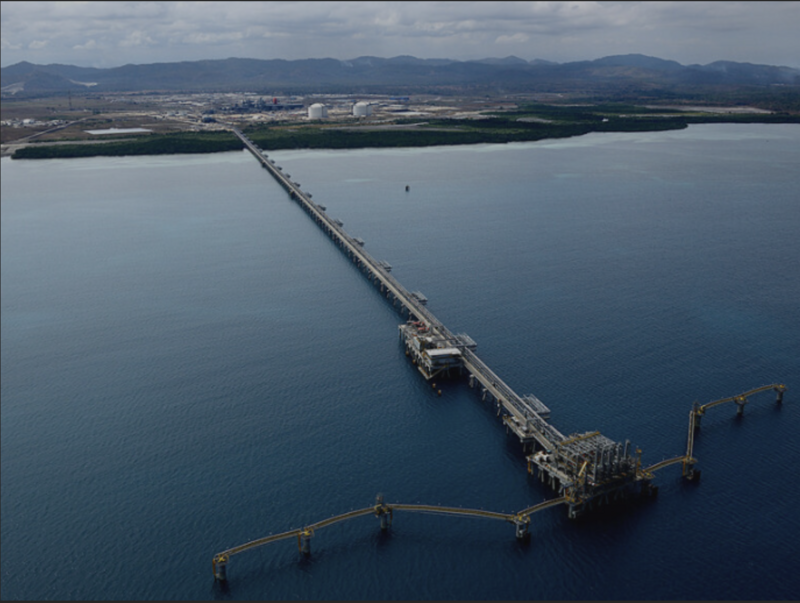
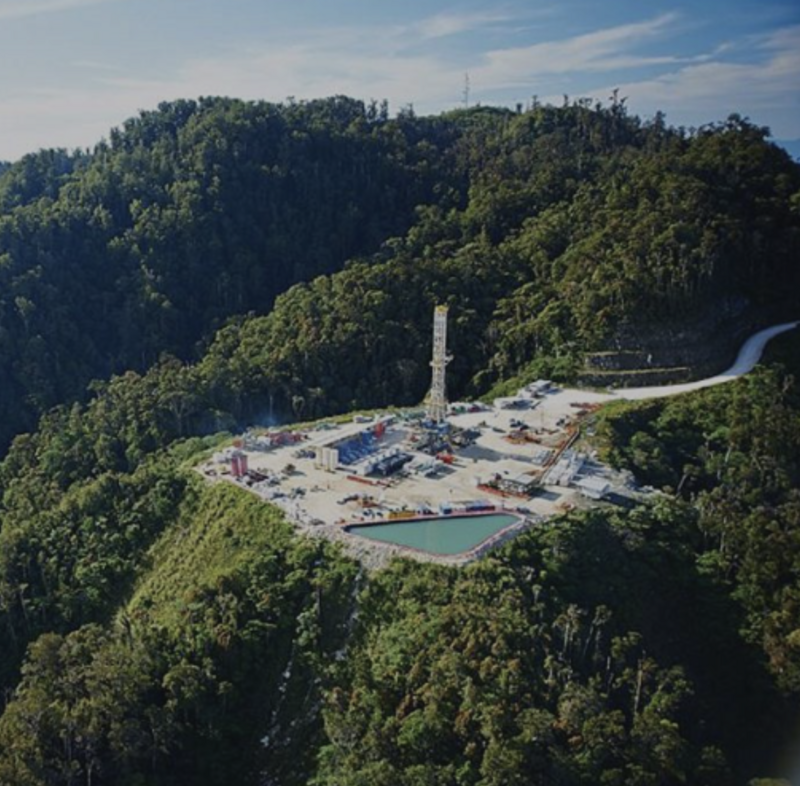
The PNG LNG Project is operated by ExxonMobil PNG Limited on behalf of its fellow venture partners which include Santos, Kumul Petroleum Holdings Limited, the Mineral Resources Development Company and Eneo. Natural gas is produced from the well sites of the Hides and Angore gas fields in Hela Province and then treated at the Hides Gas Conditioning Plant, and joined by gas from the Kutubu and Agogo fields in the Southern Highlands Province. The natural gas is transported through an onshore and offshore gas pipeline system of overall length of approximately 700 kilometres to a two-train liquefaction plant at Caution Bay in Central Province. The LNG is then stored and loaded onto oceangoing LNG tankers for transport. Natural gas condensates recovered during gas conditioning are blended with Kutubu crude oil and exported through the Kumul Marine Terminal as Kutubu Blend. Naphtha is also produced from final processing at the LNG plant. The PNG LNG Project currently produces up to 8 mta LNG. Since LNG production commenced in 2014 to the end of 2025, the PNG LNG Project has loaded 1,259 cargoes of LNG plus some 123 cargoes of naphtha containing 94.5 mta LNG equivalent primarily for long-term customers across East Asia.
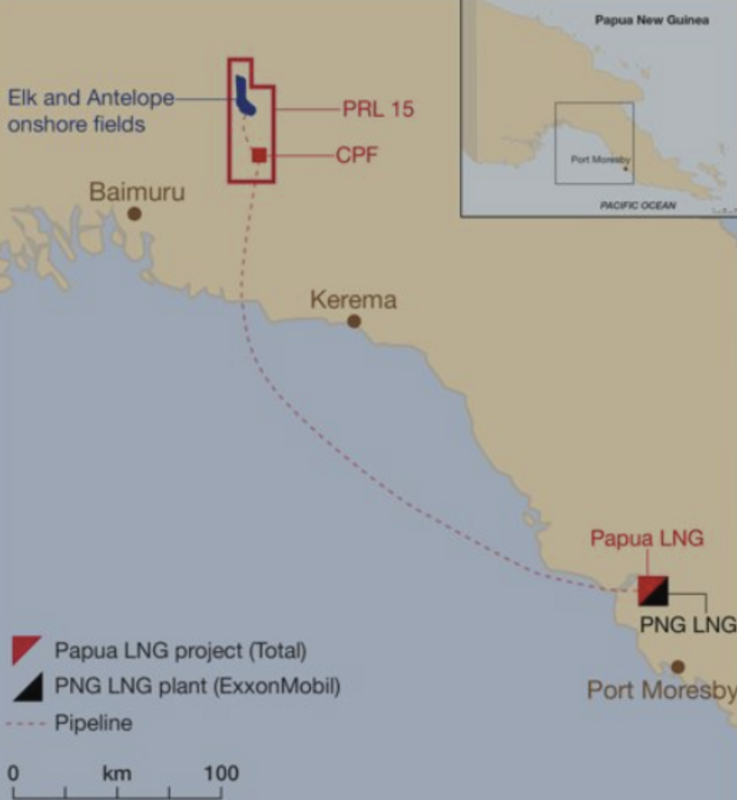
The Papua LNG Project proposes a development of the Elk-Antelope gas field for the production of 6 mta LNG. TotalEnergies is the operator of this project on behalf of co-venturers ExxonMobil, Santos and Eneos. The Papua New Guinea government has a statutory right to take up to a 22.5% equity interest in the project. It seeks to become the country’s second LNG project by commercialising natural gas resources in the Gulf Province for export to the global market. Gas will be produced and conditioned in the field for pipeline transmission to four new electrically driven 1 mta liquefaction trains to be located adjacent to its existing PNG LNG Project liquefaction facilities. Ullage in the PNG LNG Project liquefaction plant is also expected to provide a further 2 mta processing capacity. ExxonMobil as a co-venturer has been delegated as the Papua LNG Project’s downstream operator.
The P’nyang LNG Project plans to develop the P’nyang gas field discovered in 1990 and located in the northern part of the Western Province in Petroleum Retention License 3. The field is estimated to have recoverable gas resources of about 4.6 TCF. In 2022, the P’nyang LNG Projects Gas Agreement was executed, followed by its Fiscal Stability Agreement in 2024. The field, which is located 130 km northeast of the Hides gas field will most likely be developed after the Papua LNG Project development, and will most likely link into existing gas pipeline infrastructure and the LNG plant. It is planned to produce 2.7 mta LNG. The project is led by ExxonMobil as operator on behalf of co-venturers Santos and Eneos. The Papua New Guinea government has a statutory right to take up to a 22.5% equity interest in the project.